
JOLTS Report: Goldilocks lives another day
JOLTS Report: Goldilocks lives another day

Lede
Goldilocks lives another day and is in line with our post “Today: Inconceivably Good; How is This Possible?”
Job openings fell below estimates while remaining very strong.
Quits dropped and are back to pre-COVID norms.
Manufacturing employment was better than expected (though still contracting).
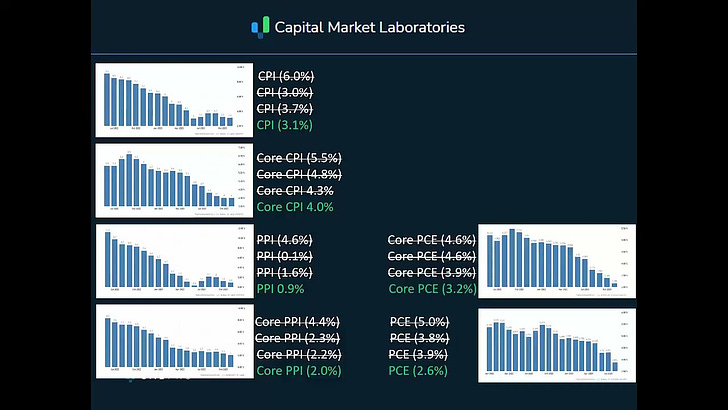
Manufacturing prices were lower than expected.
Hire rate hits decade low.
Let’s talk about it.
Preface
The good news and return to normalcy that I discussed at great length in the prior post (video) has continued - at least for today.
You can watch the video if you’d like to get caught up:
The JOLTS (Job Openings and Labor Turnover Survey) report delivers two pieces of data that the Fed openly follows: job openings and job quits.
The number of job openings had ballooned through the COVID recovery and the demand for workers (number of openings) was thought to put pressure on wage inflation.
Wage inflation, if it persists, is quite the problematic type of inflation was it can create a wage-price spiral:
The wage-price spiral is an economic concept where rising wages increase disposable income, boosting consumer demand and prices, which then leads to higher demand for wages, creating a cycle of wage and price increases.
But, the as the number of job openings have fallen so too has wage inflation and that troublesome irritant has been avoided.
Today, job openings came in at 8.79M versus estimates of 8.85M and 8.852M last month.
These are still huge numbers and point to a remarkably robust employment market, but the trend is in the right direction and it is the lowest level in more than two years.
Here is a chart we will reprise:
JOLTS Job Openings
")
An excellent trajectory (as long as it doesn’t go too low).
On the other side of the wage-price spiral irritant is quits: the number of people quitting jobs.
If that number rises too high it signals that workers are quitting jobs to find new ones that pay more: wage inflation.
The quit rate got so high in the height of fear surrounding inflation that it got a new name: “The Great Resignation.”
It turns out that fear was overblow too. Today the quits rate hit 2.2%; the lowest since September 2020.
Here is a chart of quits that we reprise later, but I drew in a red line that shows the pre-COVID level:
Quits

Normalcy has been reached. That’s a big win.
We can look at the quit rate with the hire rate together and again, we see normalcy returning (source).

As I said on the comprehensive economic review in the prior post, this is Goldilocks area, but…
… economic data trajectories tend not to stop exactly at target, so, excellent for now, and, let’s see this trend flatten out over the next six-months to get the no recession “soft landing” scenario.
The hire rate in economics refers to the proportion of job seekers who are successfully hired within a specific period, typically indicating the health of the job market. That has hit a decade low (excluding COVID).
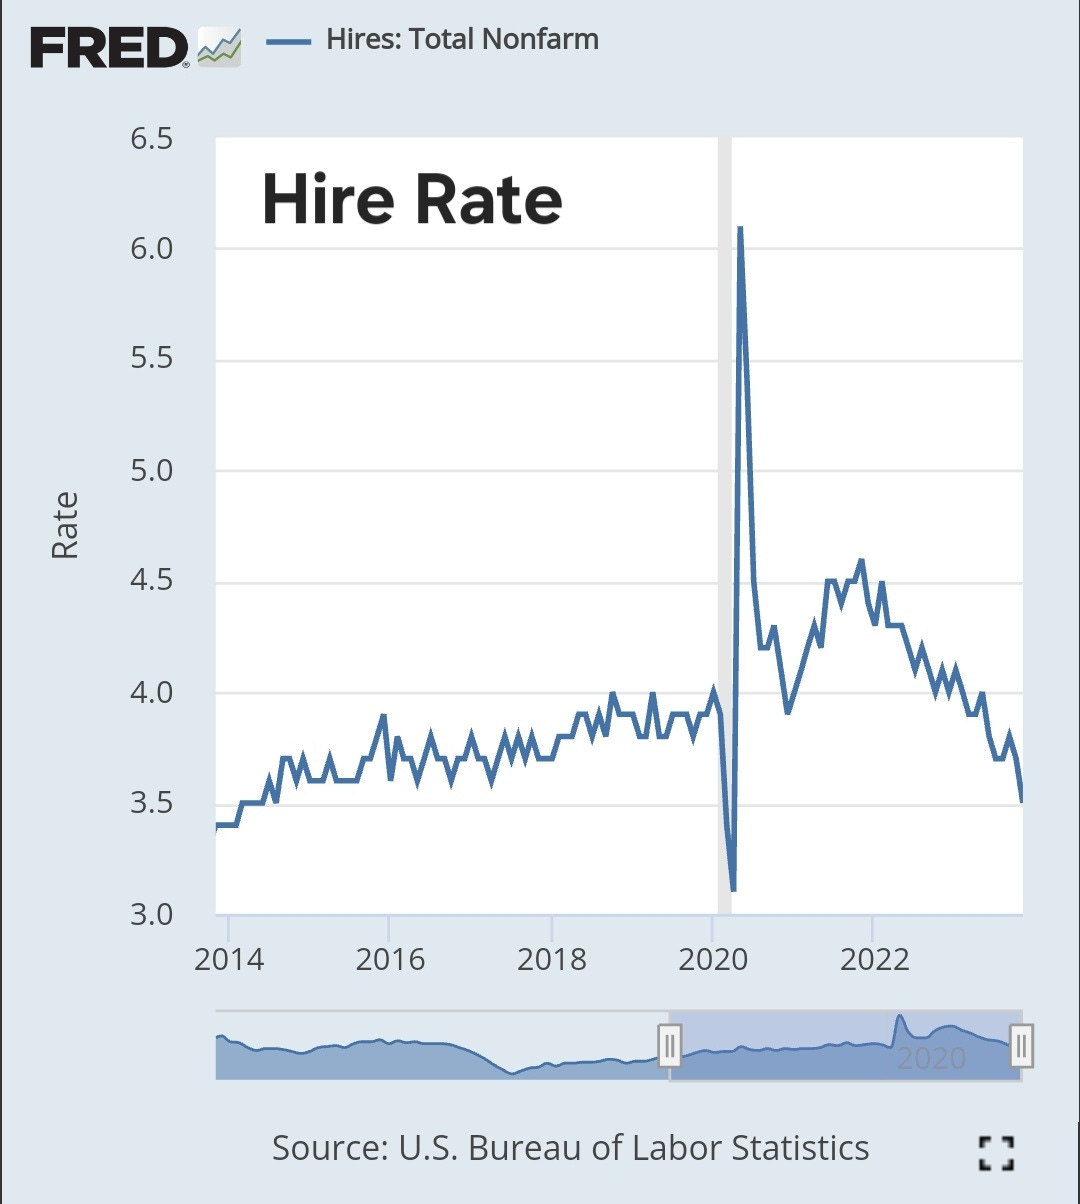
This is where we say, “ok, the ‘normalization’ can stop now.
There was more today as well, surrounding the ISM (Institute for Supply Management) Purchasing Managers Index (PMI) in the manufacturing portion.
Manufacturing Employment was better than expected 48.1 versus 46.1 estimates and 45.8 prior).
US ISM Manufacturing Prices Paid came in lower than expected at 45.2 vs 47.5 consensus and 49.9 prior.
We note that these are diffusion indexes, so a number below 50 indicates contraction and above 50 indicates expansion.
But, however we slice it today, employment was better than expected and prices were lower than expected.
Treasury yields were slightly higher on the good economic data:

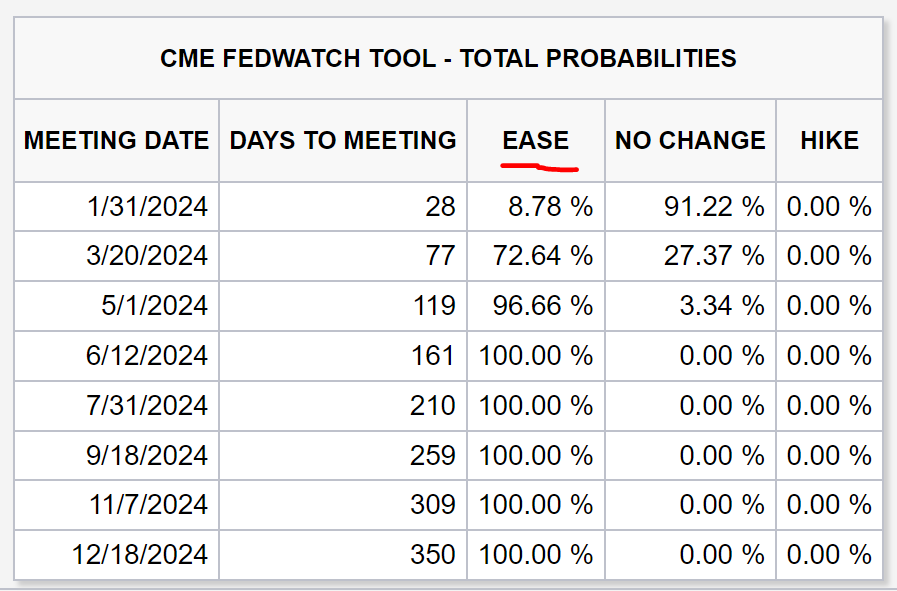
The futures market now places a 72% chance of a rate cut by the Fed in the March meeting and a 97% chance in the May meeting.
Data Lede
US Job Openings (JOLTS):
8.79M vs 8.85M consensus and 8.852M prior.
US Job Quits (JOLTS):
3.471M and 3.628M prior.
US ISM Purchasing Managers Index (PMI):
47.4 vs 47.1 consensus and 46.7 prior.
US ISM Manufacturing Employment:
48.1 vs 46.1 consensus and 45.8 prior.
US ISM Manufacturing New Orders:
47.1 and 48.3 prior.
US ISM Manufacturing Prices Paid:
45.2 vs 47.5 consensus and 49.9 prior.
Context and Charts - US Job Openings (JOLTS)
US Job Openings (JOLTS) is 8.79M, with 8.85M consensus estimates, and 8.852M in the prior month.
The Fed wants job openings (demand for workers) to drop in order to cool wage inflation.
In the United States, job openings refer to all positions that are open (not filled) on the last business day of the month.
US Job Openings (JOLTS) 10-Year chart (Source)
Context and Charts - US Job Quits (JOLTS)
US Job Quits (JOLTS) is 3.471M, with no consensus estimates, and 3.628M in the prior month.
US Job Quits (JOLTS) 10-Year chart (Source)
")
Context and Charts - US ISM Purchasing Managers Index (PMI)
US ISM Purchasing Managers Index (PMI) is 47.4, with 47.1 consensus estimates, and 46.7 in the prior month.
The Manufacturing ISM Report On Business is based on data compiled from purchasing and supply executives nationwide.
A PMI reading above 50 percent indicates that the manufacturing economy is generally expanding; below 50 percent indicates that it is generally declining.
US ISM Purchasing Managers Index (PMI) 10-Year chart (Source)
")
Context and Charts - US ISM Manufacturing Employment
US ISM Manufacturing Employment is 48.1, with 46.1 consensus estimates, and 45.8 in the prior month.
A reading above 50 percent indicates that the manufacturing economy is generally expanding; below 50 percent indicates that it is generally declining.
US ISM Manufacturing Employment 10-Year chart (Source)

Context and Charts - US ISM Manufacturing New Orders
US ISM Manufacturing New Orders is 47.1, with no consensus estimates, and 48.3 in the prior month.
A reading above 50 percent indicates that the manufacturing economy is generally expanding; below 50 percent indicates that it is generally declining.
US ISM Manufacturing New Orders 10-Year chart (Source)

Context and Charts - US ISM Manufacturing Prices Paid
US ISM Manufacturing Prices Paid is 45.2, with 47.5 consensus estimates, and 49.9 in the prior month.
A reading above 50 percent indicates that the manufacturing economy is generally expanding; below 50 percent indicates that it is generally declining.
US ISM Manufacturing Prices Paid 10-Year chart (Source)

Conclusion
This period is a wonder - a series of inconceivable data that, for a moment, are more than good, they are exceptionally good. But, don’t get slap happy.
Take the good as good. Then recalibrate and think about the future.
If you enjoy these posts and want deeper economic analysis and then the meat on the bone: a stock research service with Top Picks and performance double verified by an audit firm and then a hedge fund tracking firm, check out CML Pro.
For about a dollar a day you’ll have great access to company CEOs, expert channel checks, economic research, and our Top Picks list. That price is going rise by 2-fold in 2024 (inflation is real).
Now is the time to look at the “after this” period. That is, not just now, next month, and the month after that, but after the inflationary irritant is removed and after the potential recession that follows it; after this.
We have named nine “after this” winners thus far and the portfolio is up 74% YTD.
From January 1, 2016 through June 31, 2023 (more than 7.5 years) this how our tracking portfolio has done relative to other benchmarks:
Jan 1, 2016 - Jun 31, 2023
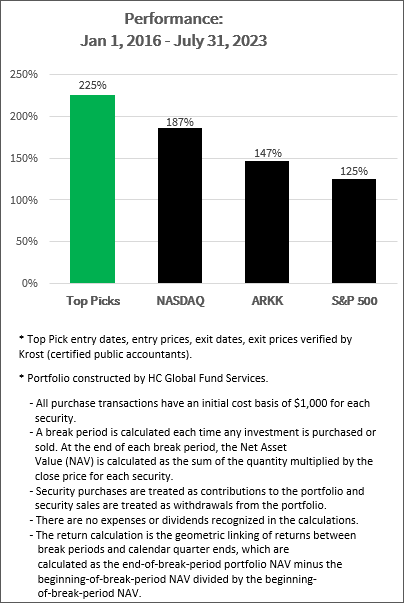
We have an eye toward the “after this” period and have named nine after this winners.
Get access to those nine names and all of our research and our community at CML Pro here.
Legal
The information contained on this site is provided for general informational purposes, as a convenience to the readers. The materials are not a substitute for obtaining professional advice from a qualified person, firm or corporation. Consult the appropriate professional advisor for more complete and current information. Capital Market Laboratories (“The Company”) does not engage in rendering any legal or professional services by placing these general informational materials on this website.
The Company specifically disclaims any liability, whether based in contract, tort, strict liability or otherwise, for any direct, indirect, incidental, consequential, or special damages arising out of or in any way connected with access to or use of the site, even if I have been advised of the possibility of such damages, including liability in connection with mistakes or omissions in, or delays in transmission of, information to or from the user, interruptions in telecommunications connections to the site or viruses.
The Company makes no representations or warranties about the accuracy or completeness of the information contained on this website. Any links provided to other server sites are offered as a matter of convenience and in no way are meant to imply that The Company endorses, sponsors, promotes or is affiliated with the owners of or participants in those sites, or endorse any information contained on those sites, unless expressly stated.