

Inflation Higher Than Estimates; Sort Of
Inflation Higher Than Estimates; Sort Of

Written by Ophir Gottlieb
Lede
And again…
Shelter index constituted over two-thirds of the total increase in inflation; a painfully lagged measure that everyone knows, even the BLS, and we all just watch it in awe of its ineffectiveness.
CPI YoY came in hotter than expected driven by base effects and will drop significantly next month due to… base effects.
And now, let’s talk about it.
Story
Today was inflation day and as is often the case with December and January data, economic data just gets weird right now.
You can see our posts from last year surrounding non farm payrolls, how manic those numbers were and how well the year went after that.
Annual headline inflation (CPI) rose to 3.4% YoY versus estimates of 3.2% and 3.1% prior. The month over month (MoM) number rose 0.3% versus estimates of 0.2% and last month’s 0.1%.
Roughly half of the increase in December was due to the owners' equivalent rent series, yes that painfully lagged measure of rent.
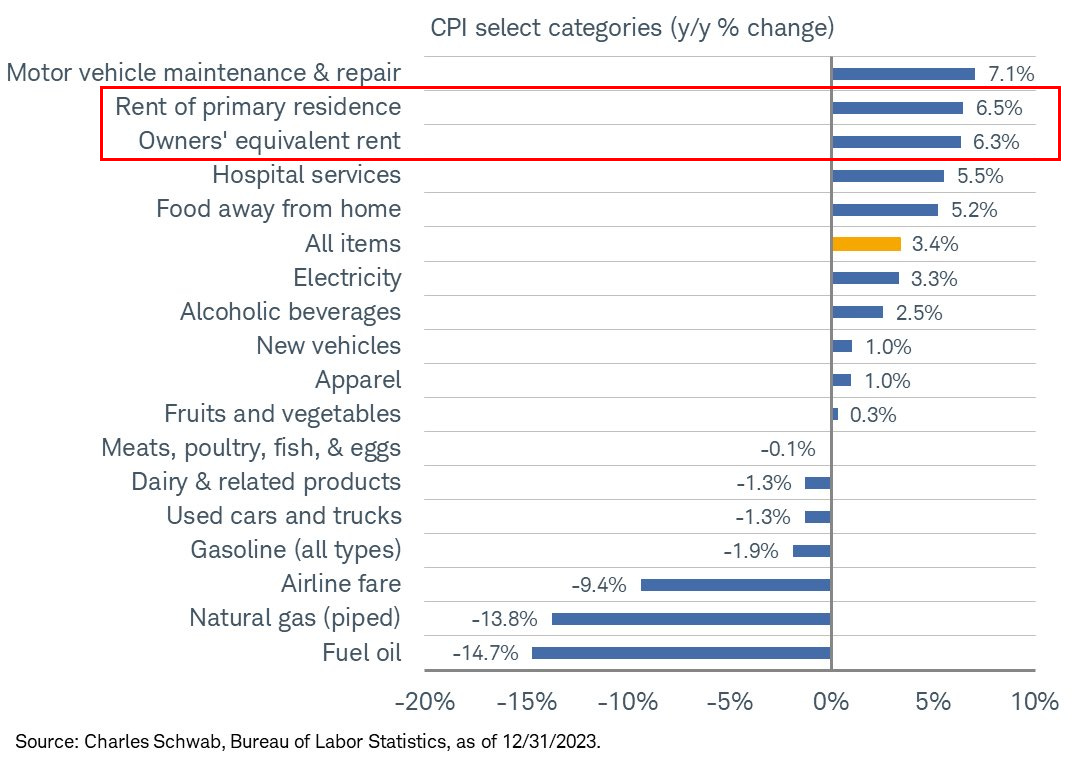
Here is a breakdown of the categories that impacted inflation and the second and third largest drives are rent:
And here is a chart from Joseph Politano showing that essentially all of inflation is now rent (the yellow bars):

Shelter makes of fully 32% of the CPI computation.
The shelter index continued its upward trend, rising by 0.5% (compared to 0.4%), contributing to over half of the monthly increase in all items.
Basically, the entire world economy is being led by the nose by a lagged measure that the BLS itself has written about and noted the 4-6 quarter lag: this is not clever analysis, this is known.
And here is a chart of the lagged measure of rent:
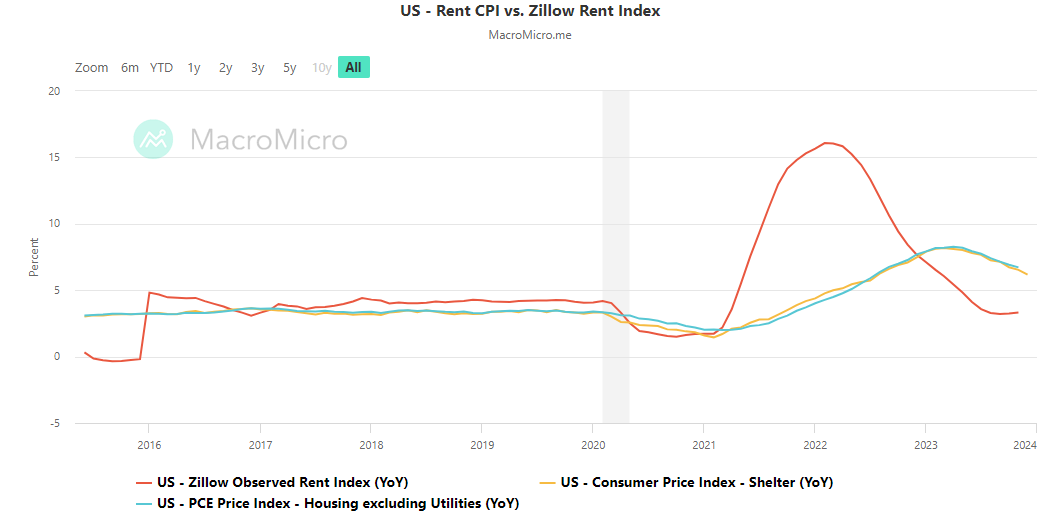
We know that the green line (CPI) will reach about the orange line (the actual change in asking rent), but until then, I’ll repeat this same text over and over (and over and over).
Further, while these numbers read quite poorly for the disinflation and soft landing camp, there is a base effect which is a fancy way of saying that inflation in the month that was replaced in the YoY measure (Dec 2022) was 0.1% so this 0.3% number in Dec 2023 has an outsized impact on the YoY measure (0.1% was removed and 0.3% replaced it).
Base effects fade and in fact, it will next month because Jan 2023 MoM CPI was 0.5% and that will be replaced by Jan 2024 where estimates stand at 0.19%.
So, the estimate for CPI YoY as of next month is in fact 2.97%, versus the 3.4% number we just got.
So, either we have psychotically moving inflation or nothing just happened and disinflation continues. You decide.
On the Core Inflation front (which is CPI excluding food and energy), the one that the Fed pays more attention too, the MoM number was in line with estimates of 0.3%, the same as the prior month, and the YoY rate dropped from 4.0% to 3.9% versus 3.8% estimates.
This was the lowest Core CPI YoY reading since 2021.
Still, shelter makes up 42% of Core CPI so all the same commentary above is relevant to this measure.
The inflation measure that the Fed really pays attention to is Core PCE.
PCE is a a different inflation index: it measures the prices of things people actually purchase rather than CPI which is a survey of the prices of a realtively fixed basket of goods, irrespective if people are substituting expense items with cheaper ones.
The contrived example I gave on the CML Pro webinar (where the economic piece is free for all to see here), is that if a loaf of bread all of a sudden cost $1,000,000, CPI would explode (bread is in the basket of goods measured in CPI).
But PCE, on the other hand, would be unchanged because consumers would simply forgo bread and substitute it with rice, or tortillas (or whatever).
These are both important measures of inflation, but PCE is preferred by the Fed and that measure just came in at 2.6% YoY (versus CPI which just came in at 3.4% YoY).
Even further, estimates for December PCE and Core PCE YoY are 2.70% and 3.0%, respectively and drop to 2.3% and 2.8% for January.
So, in the PCE world, inflation is already dead (or pretty close).
If all of this reads like someone trying to calm people down, it is a little, but just look at the treasury yields market:
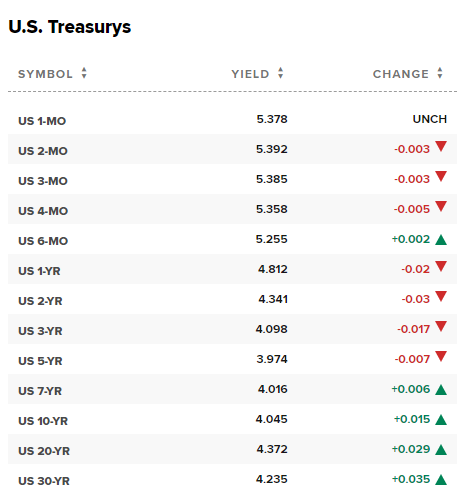
Basically, the rates are unchanged on this news and short-term rates are actually lower. This is a reflection, at for today, that the market is not taking the inflation rising as anything other than, well… all the stuff I wrote above.
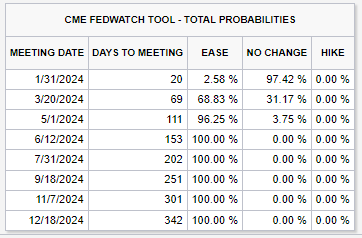
The probabilities for a rate cut (“ease”) are still quote high for March and extraordinarily high for May:
We’ll see how the data plays out: both economic and inflation.
Tomorrow we get PPI (as opposed to CPI today), which is the producers inflation measure. Portions of this wholesaler inflation do directly feed into PCE so tomorrow matters too.
On the weekly jobless numbers, they again came in low, signaling anything other than a weak job market - its robust and remains so (for now).
Alright, that’s it!
Data Lede
US Inflation Rate (CPI YoY):
3.4% vs 3.2% consensus and 3.1% prior.
US Inflation Rate (CPI MoM):
0.3% vs 0.2% consensus and 0.1% prior.
US Core Inflation Rate (Core CPI YoY):
3.9% vs 3.8% consensus and 4% prior.
US Initial Jobless Claims:
202K vs 210K consensus and 203K prior.
US Continuing Jobless Claims:
1834K vs 1871K consensus and 1868K prior.
US Jobless Claims 4-week Average:
207.75K and 208K prior.
Context and Charts - US Inflation Rate (CPI YoY)
- US annual inflation rate increased to 3.4% in December 2023 from 3.1% in November, surpassing the 3.2% market forecast.
- Energy prices decreased by 2% in December (compared to -5.4% in November).
- Gasoline prices fell by 1.9% (compared to -8.9%), utility (piped) gas service dropped by 13.8% (compared to -10.4%), and fuel oil declined by 14.7% (compared to -24.8%).
- Food prices increased at a slower pace, rising by 2.7% (compared to 2.9%).
- Shelter costs increased by 6.2% (compared to 6.5%).
- New vehicles saw a price increase of 1% (compared to 1.3%).
- Apparel prices increased by 1% (compared to 1.1%).
- Medical care commodities increased by 4.7% (compared to 5%).
- Transportation services rose by 9.7% (compared to 10.1%).
- Used cars and trucks continued to decline, with a decrease of -1.3% (compared to -3.8%).
The headline year-over-year (YoY) CPI report is what is referred to as 'inflation' in the media.
The Fed's long-term target is 2%.
US Inflation Rate (CPI YoY) 10-Year chart (Source)
")
Context and Charts - US Inflation Rate (CPI MoM)
- US consumer prices increased by 0.3% in December 2023, the highest in three months, compared to a 0.1% rise in November, exceeding the expected 0.2% increase.
- The shelter index continued its upward trend, rising by 0.5% (compared to 0.4%), contributing to over half of the monthly increase in all items.
- Motor vehicle insurance index showed a slight uptick of 1.5%, following a 1% rise in the previous month.
- Used cars & trucks index rose by 0.5%, down from a 1.6% surge in November.
- Other indexes that experienced growth in December included recreation, new vehicles, education, and airline fares.
- The energy index increased by 0.4%, driven by rises in the electricity index (1.3%) and the gasoline index (0.2%), which more than offset a decline in the natural gas index (-0.4%).
- The food index also increased by 0.2%, the same as in November.
- Conversely, the index for household furnishings & operations decreased by -0.4%, and the index for personal care declined by -0.3% during the month.
US Inflation Rate (CPI MoM) 10-Year chart (Source)
")
Context and Charts - US Core Inflation Rate (Core CPI YoY)
- Annual core consumer price inflation rate in the US, excluding food and energy, decreased to 3.9% in December 2023, marking a 2.5 year low, down from 4% in the previous month and slightly above the expected 3.8%.
- The shelter index, which constitutes over two-thirds of the total increase in all items excluding food and energy, softened to 6.2% in December from 6.5% in the previous month.
- Other indexes with slower year-over-year increases included motor vehicle insurance (+19.2% vs +20.3%), recreation (+2.5% vs +2.7%), and personal care (+5% vs +5.2%).
- Monthly core consumer prices only rose by 0.3% in December, the same as in November, aligning with market estimates.
The Core CPI year-over-year (YoY) report removes the impact of food and energy from the CPI report.
Core CPI is considered by some a better gauge of inflation as it removes much of commodity price changes from the computation.
The Fed's long-term target is for 2% Core CPI as it is for the headline CPI report.
US Core Inflation Rate (Core CPI YoY) 10-Year chart (Source)
")
Context and Charts - US Initial Jobless Claims
Initial jobless claims measures new and emerging unemployment.
US Initial Jobless Claims 18-Month chart (Source)

Context and Charts - US Continuing Jobless Claims
US Continuing Jobless Claims is 1834K, with 1871K consensus estimates, and 1868K in the prior month.
Continuing Jobless Claims refer to actual number of unemployed and currently receiving unemployment benefits who filed for unemployment benefits at least two weeks ago.
US Continuing Jobless Claims 18-Month chart (Source)

Context and Charts - US Jobless Claims 4-week Average
US Jobless Claims 4-week Average is 207.75K, with no consensus estimates, and 208K in the prior month.
US Jobless Claims 4-week Average 18-Month chart (Source)

Conclusion
Alright, that’s all I’ve got for today; tomorrow is PPI.