Daily Economics - FOMC Remains Hawkish; Jobless Claims Remain Low; Building Permits Revised Higher
Preface
Yesterday the FOMC raised the target Federal Funds interest rate by 0.25% (25bps).
The Fed’s summary of economic projections (SEP) showed several key elements:
» GDP growth will slow - this is consistent with prior SEPs.
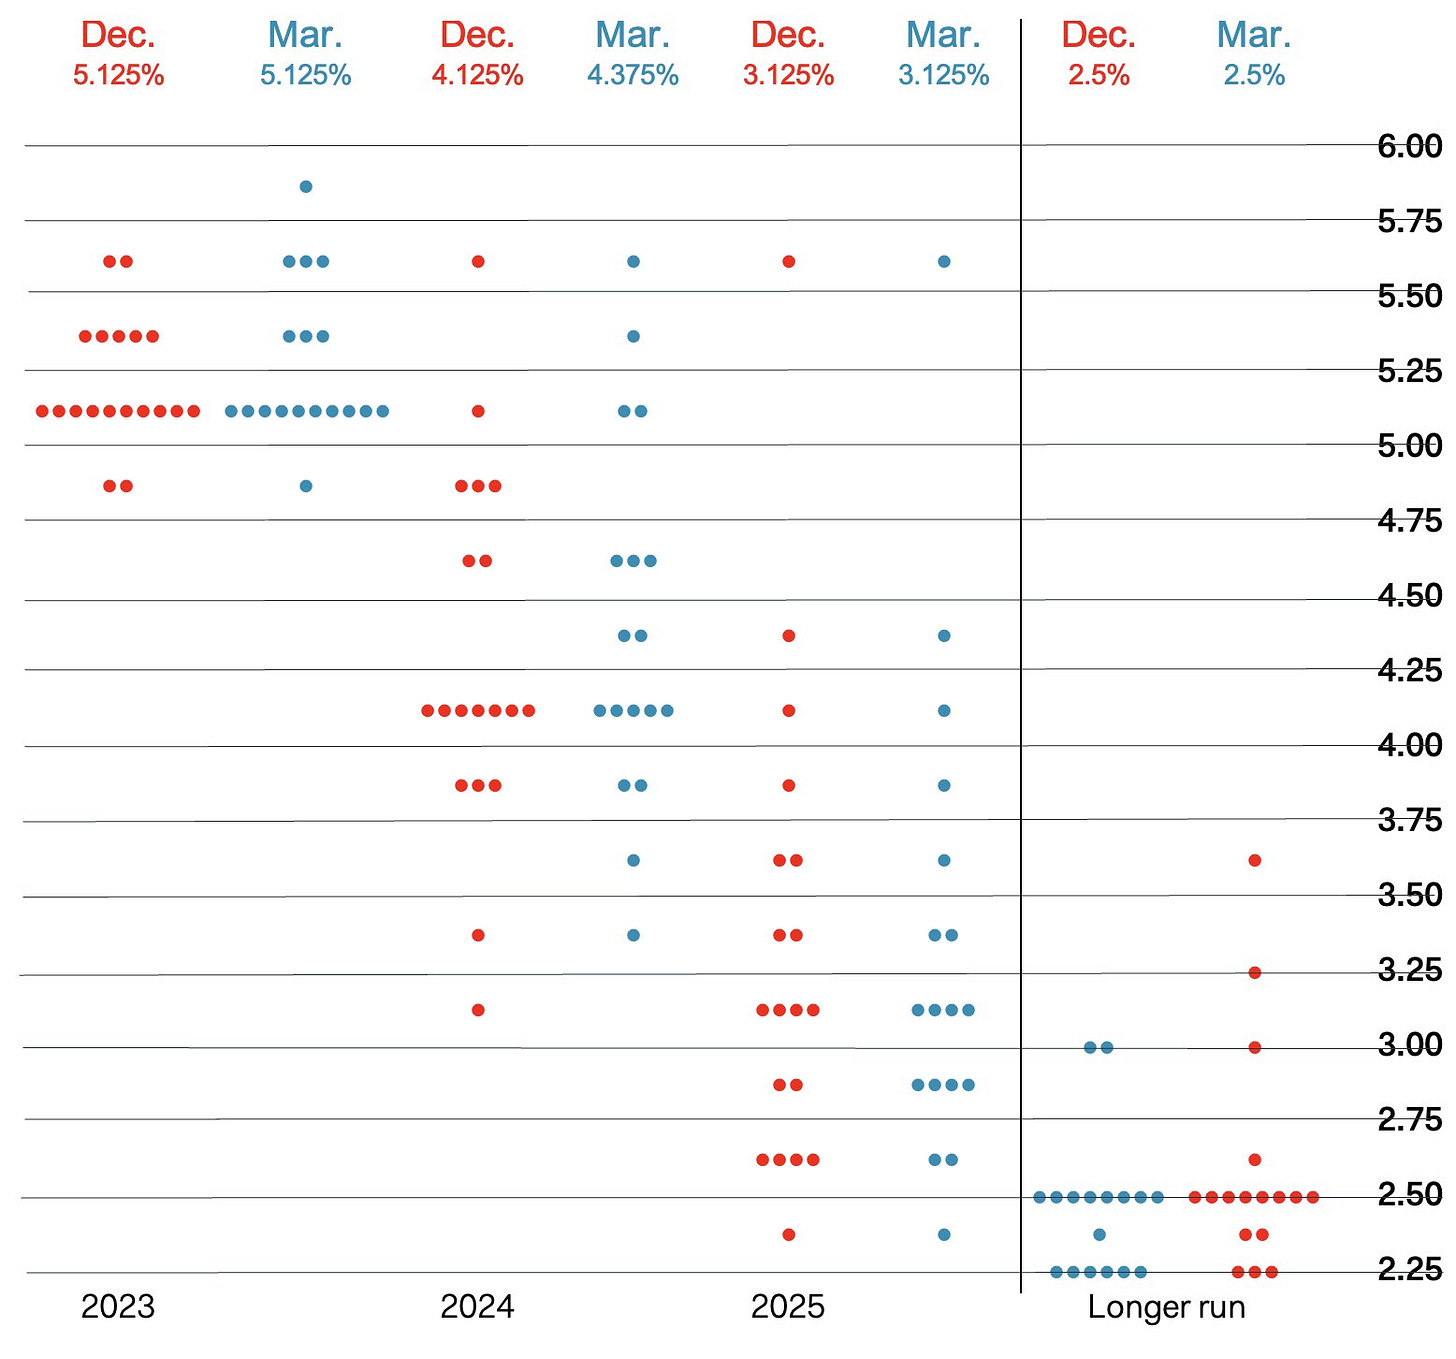
» The year end target Fed Funds rate (dot plot) remained at about 5.1%, with still 7 out of 18 participants forecasting 5.25% or higher by year end.
» Only one Fed participant forecast a fed Funds rate below 5%.
» No Fed participants forecast any rate cuts this year.
» Fed participants raised their 2024 year end Fed Funds rate forecast.
Here is the dot plot full context, and a side-by-side comparison to the levels from the last SEP. This marked up chart comes from Ian Shepherdson; Chief Economist, Pantheon Macroeconomics.
There were no substantial changes, but we do note it is a little more hawkish than the prior SEP and the spread in 2024 and 2025 is quite large, indicating little resolution into the future.
In all, while we have read both dovish and hawkish takes, the message from the dot plots reads clearly to us: The Fed has been unmoved by the recent banking discord and still sees inflation too high, and requiring more quantitative tightening.
Or, as we are wont to say, inflation is the only thing that matters.
As for data that we received today, weekly jobless claims numbers again came in quite low, hovering around the 190K level and below consensus estimates.
Building permits (the final read) were revised yet higher for both single family and multi-family dwellings, showing the highest reading in five-months.
The month-over-month (MoM) number was also revised higher, to a 15.8% increase versus initial estimates of a 13.8%. It is the biggest rise since July of 2020.
We don’t formally cover it on Daily Economics, but we note that the Chicago Fed National Activity Index declined to -0.19 in February 2023 from +0.23 in January.
All four broad categories of indicators used to construct the index made negative contributions, and three categories deteriorated from January.
Yields in the early morning trade look tame, and in general have reacted rather to the contrary of the Fed’s forecast.
We note that the 6-month yield is at 4.84%, while the Fed has forecast a 5.1% target by year end. The two-year yield is at 3.946%.
This is Daily Economics. While the data is fairly ubiquitous; our summary and analysis can only be found here. Please do subscribe for more posts:
Data Lede
US Initial Jobless Claims:
191K vs 197K consensus and 192K prior.
US Continuing Jobless Claims:
1694K vs 1684K consensus and 1680K prior.
US Jobless Claims 4-week Average:
196.25K and 196.5K prior.
US Building Permits:
1.55M and 1.339M prior.
Context and Charts - US Initial Jobless Claims
The number of Americans filing for unemployment benefits fell by 1,000 to 191,000 on the week ending March 18th, compared to expectations of 197,000.
The result pointed to further evidence of a stubbornly tight labor market, in line with the hot payroll figures for February and the Federal Reserve's outlook of low unemployment.
The tight job market forces employers to raise wages to attract and keep staff, magnifying inflationary pressure on the American economy and adding leeway for the central bank to continue tightening monetary policy.
The four-week moving average, which removes week-to-week volatility, fell by 250 to 196,250.
On a non-seasonally adjusted basis, initial claims fell by 4,659 to 213,425, with notable declines in California (-2,411) and Illinois (-1,135).
Initial jobless claims measures new and emerging unemployment.
US Initial Jobless Claims 18-Month chart (Source)
Context and Charts - US Continuing Jobless Claims
US Continuing Jobless Claims is 1694K, with 1684K consensus estimates, and 1680K in the prior month.
Continuing Jobless Claims refer to actual number of unemployed and currently receiving unemployment benefits who filed for unemployment benefits at least two weeks ago.
US Continuing Jobless Claims 18-Month chart (Source)
Context and Charts - US Jobless Claims 4-week Average
US Jobless Claims 4-week Average is 196.25K, with no consensus estimates, and 196.5K in the prior month.
US Jobless Claims 4-week Average 18-Month chart (Source)
Context and Charts - US Building Permits
Building permits in the US were revised higher to a seasonally adjusted annual rate of 1.55 million in February of 2023, from an initial estimate of 1.524 million.
It remains the highest reading in five months, with both single-family (8.9% to 786 thousand vs an initial rate of 777 thousand) and multi-segment authorizations (23.8% to 764 thousand vs 747 thousand) revised higher.
Permits were up in all four regions: the South (13.3% to 863 thousand vs an initial 845 thousand), West (28.3% to 376 thousand vs 381 thousand), Midwest (10.1% to 196 thousand vs 195 thousand), and the Northeast (8.5% to 115 thousand vs 103 thousand).
Building Permits refer to the approvals given by a local jurisdictions before the construction of a new or existing building can legally occur.
Not all areas of the United States require a permit for construction.
US Building Permits 18-Month chart (Source)
US Building Permits 10-Year chart (Source)
Next Report - Friday, Mar 24th Will Cover...
US Durable Goods Orders
S&P Global US Composite PMI
S&P Global US Services PMI
US Manufacturing PMI
New Charting Platform - Pattern Finder
If you want a system to find breakout stock charts try this:
You can watch a rather riveting seven minute minute video here and see special pricing (ending soon): Pattern Finder: The Next Era of Charting
Thanks for reading Daily Economics!


