

CPI and Core CPI Come in 'January' Hot
CPI and Core CPI Come in 'January' Hot

Lede
US Inflation Rate (CPI YoY):
3.1% vs 2.9% consensus and 3.4% prior.
US Inflation Rate (CPI MoM):
0.3% vs 0.2% consensus and 0.2% prior.
US Core Inflation Rate (Core CPI YoY):
3.9% vs 3.7% consensus and 3.9% prior.
US Core Inflation Rate (Core CPI MoM):
0.4% vs 0.3% consensus and 0.3% prior.
Preface
As is often the case, maybe even the rule, January inflation numbers came in at levels a bit off from consensus estimates just as the non farm payrolls number did.
We see this often and did last year as well.
In general, In January, the trend towards lower inflation rates did not expand, with the super core-services excluding housing rising by 4.3% year-over-year (YoY), services increasing by 4.9%, and services excluding energy climbing by 5.4%.
Then there’s the shelter component, which is all rent as home prices are not in CPI.
Shelter accounts for 32% of CPI and 42% of Core CPI and shelter accounted for 2/3 of the inflation seen in January. yep, nearly 70%.
And, again, contrary to real-time data, official figures show housing prices remain persistently high. Housing costs rose by 4.6%, with the policy-sensitive Owners' Equivalent Rent (OER) up by 6.2%, and shelter costs increasing by 6%.
Here is what CPI reads versus what a real time rent indicator reads:
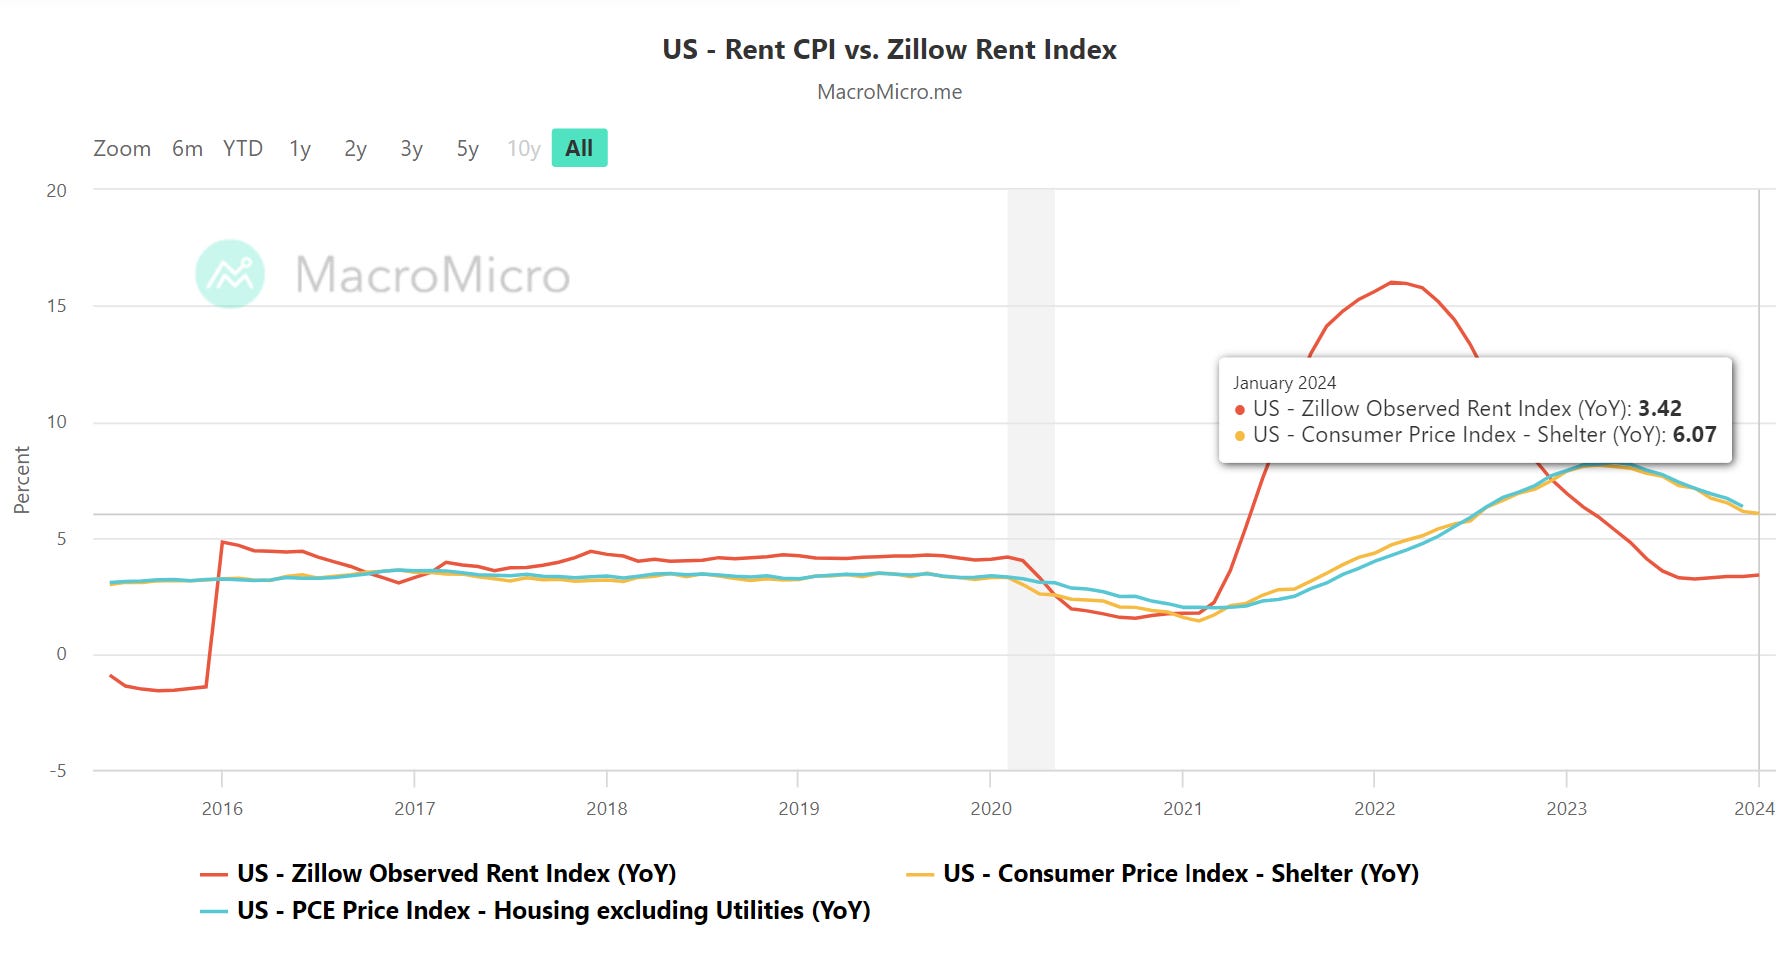
That red line is Zillow, while the orange is CPI.
The difference is 3.42% (Zillow) YoY versus 6.07% (CPI) YoY.
This is a bit of a silly computation, but let’s just be silly:
If we swap the Zillow real time rent index for the CPI index, shelter inflation would be 2.65% lower YoY.
Since that’s 32% of CPI, the year over year measure for CPI, which is now 3.1%, would be 32% of 2.65% lower, or 0.85% lower, yielding a CPI over the last year of 2.25%.
We can do the same for Core CPI, where shelter is fully 42% of the index.
Core CPI would go from 3.9% to 2.78%.
Now, it’s not correct to only account for real time rents in shelter, so the reality is somewhere in between those actual numbers versus contrived real time numbers, but in any case, actual inflation as measured by CPI is considerably lower than the numbers we get from the Bureau of Labor Statistics (BLS).
To go even deeper on this issue, shelter inflation has two parts: rent of primary residence (i.e. rent) and owners’ equivalent rent (OER).
OER in the CPI measures the hypothetical price homeowners would pay to rent their own homes, serving as a proxy for housing inflation.
We have a problem: home owners’ see their homes’ possible rent value rising while in the real world, rent are falling.
Here is a spectacular image from Joseph Brusuelas:

Actual rent inflation for CPI, illustrated in the dark purple bars is falling, just like Zillow. But… home owners are stuck in a different reality; see how the light blue bar this month popped.
Yep, that’s basically half the inflation ‘problem’ and was 67% of the inflation ‘problem’ in January.
Here is another chart of the same phenomenon from RenMac: Renaissance Macro Research:

So, the world economy, and especially the US economy, is being led by the tail by… homeowners’ view of their hypothetical rental value…
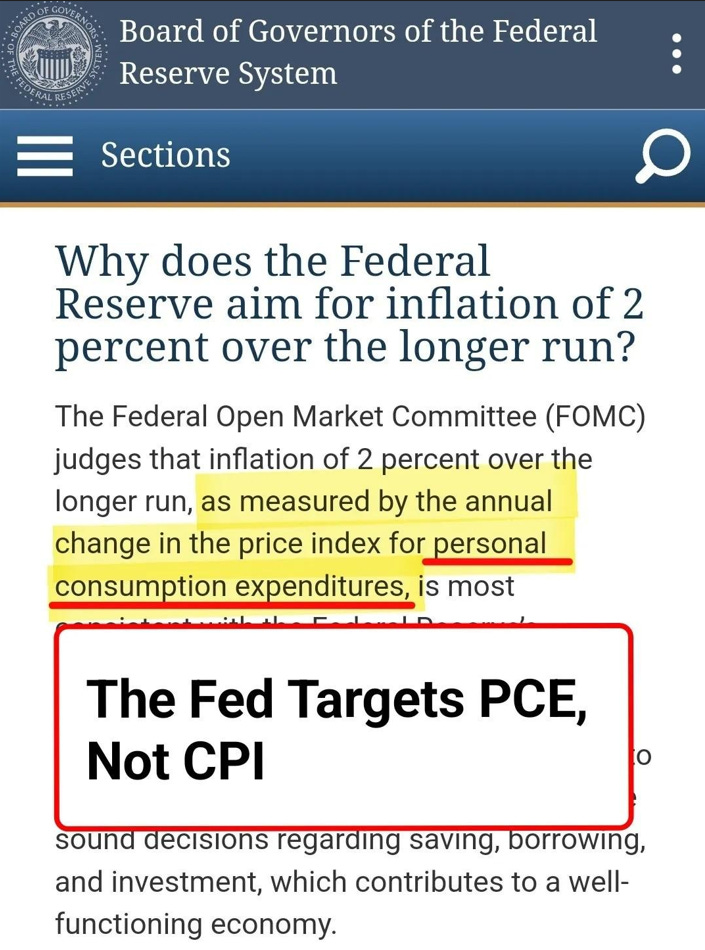
On the other hand, PCE inflation, which is what the Fed actually watches, is 2.7% YoY and estimates are for 2.2% for January when the numbers come out in late Feb.
That’s basically the Fed’s target of 2%.
Here is the snippet about the Fed watching PCE and not CPI:
To be sure, shelter is not the only difference between CPI and PCE, in fact shelter is a small difference.
While the Consumer Price Index (CPI) measures inflation based on a fixed basket of goods and services, the Personal Consumption Expenditures (PCE) inflation index reflects changes in the cost of goods and services that consumers are actually buying, allowing for shifts in spending patterns.
This is why the Fed prefers PCE - it’s the cost of actual purchases.
The bad news for inflation today came in the form of services excluding shelter.
Here is a chart; look at core services ex-housing from Nick Timiraos:

It’s hard to miss - it’s the only curve going up rather than down.
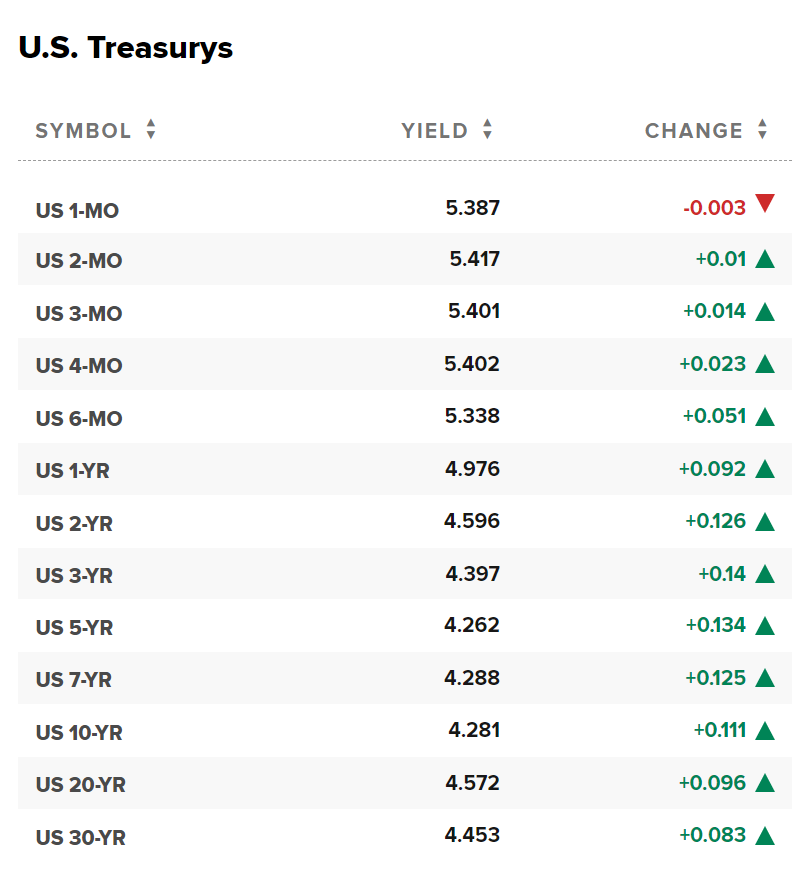
On the news treasury yields rose:
The probability of rate cut in March has fallen to 9%, and the probability of a rate cut in May has fallen to just over 39%:

Alright, that’s it for today.
Context and Charts - US Inflation Rate (CPI YoY)
- Annual US inflation rate down to 3.1% in January 2024, from December's 3.4%, above 2.9% forecast.
- Monthly CPI rose 0.3%, highest in four months, over 0.2% expected.
- Yearly core inflation steady at 3.9%, against predicted slowdown to 3.7%.
- Monthly inflation rate increased to 0.4%.
US Inflation Rate (CPI YoY) 10-Year chart (Source)
")
Context and Charts - US Inflation Rate (CPI MoM)
- US consumer prices increased 0.3% in January 2024, the highest in four months, exceeding December's 0.2% and market expectations.
- Shelter index rose by 0.6% in January, accounting for over two-thirds of the monthly overall increase.
- Food index climbed 0.4% in January, with both food at home and food away from home indexes rising by 0.4% and 0.5%, respectively.
- Energy index dropped 0.9% during the month, primarily due to a decrease in the gasoline index.
US Inflation Rate (CPI MoM) 18-Month chart (Source)
")
Context and Charts - US Core Inflation Rate (Core CPI YoY)
- Core inflation at 3.9% in January 2024, steady from previous month, above 3.7% forecast.
- Shelter index up 6.0% yearly, driving over two-thirds of core CPI increase.
- Notable yearly rises: motor vehicle insurance (+20.6%), recreation (+2.8%), personal care (+5.3%), medical care (+1.1%).
- Monthly core prices rose 0.4% in January, highest since April 2023, above 0.3% estimate.
- Core CPI excludes food and energy, considered a more stable inflation measure.
US Core Inflation Rate (Core CPI YoY) 10-Year chart (Source)
")